If yours is like most companies, you are probably focusing on continual improvement. It is a consistent standard through many quality programs like Lean Management, Six Sigma, or ISO certifications. You might see your supply chain as an area you can improve but may struggle because you do not know where to start. In fact, according to Logistics Bureau, only 22% of companies actively design their supply chains and a Statista report says as many as 21% of companies struggle with supply chain visibility. So, where can you start?
You need to start by collecting useful data from your supply chain to help you evaluate your logistics plan and find out how to reach your goals. To get you started, here are 10 simple data points you should be collecting from your supply chain.
Perfect Order Measurement
One of the most essential metrics you should record is a perfect order measurement score. This is the percentage of orders without errors and is made up of several different components including:
• On-Time-Pickup –The percentage of loads picked up on time.
• On-Time-Delivery – The percentage of loads delivered on time.
• Damage Free Delivery –The percentage of loads without damaged freight.
• Accurate Documentation – The percentage of loads with accurate documentation – (PU numbers, PO numbers, BOLs, etc.)
• Order Accuracy –The percentage of loads with the correct freight.
• Delivery in Full – The percentage of orders delivered completely – the correct freight delivered in the correct quantities.
• Rate/Bid Adherence –How the carrier’s actual rates per load compare to their bid or contract rate.
This metric is helpful in creating a carrier scorecard. A carrier’s score correlates to their Perfect Order score and can help you decide if a carrier is meeting your expectations. You can establish standards based on the individual data points incorporating the Perfect Order and grade your carriers accordingly. If a carrier falls beneath your standard, you can address it with them for correction, or find alternative options for your freight.
Tender Acceptance
This metric is popular with carriers on a contracted lane. Throughout the lane bidding process, you will often commit to volume and the carriers will commit to capacity. Tracking tender acceptance is a way for you to monitor if they are keeping up with their commitment. Tender acceptance is another part of your carrier scorecard that will identify if a carrier can handle your freight to your satisfaction or if you should find an alternative. Once you track tender acceptance, you will need to monitor a carrier’s fallout rate.
Fallouts
Your carrier’s fallout rate comes from the number of loads your carrier accepts, but later returns or “falls off” of for one reason or another. This is a metric for carrier compliance and reliability and is an objective measure for the risk you will take using that carrier. Most contracts stipulate how many loads a carrier will handle, and if they return a high percentage of their loads, their fallout rate measures that lack of compliance. Also, booking the same load multiple times is a hassle and costs you time and money, so you want to book with reliable carriers the first time. Carriers with high fallout rates can be a red flag for you that these carriers often cannot be trusted to handle your most critical loads.
These metrics should be time-stamped so that carriers can work to improve their score over time. You will want to know if the carriers have a pattern of failure or simply a cluster due to isolated incidents. Either way, the data will help you gauge reliability.
Transit Time
Especially with the launch of the ELD mandate, you need to know how long it takes for a shipment to be delivered. You need this information to accurately plan upcoming shipments, production schedules, and safety stock allocation. Transit times may differ depending on the type or weight of freight being shipped, the time of year, or individual carrier. It is important to chart these loads in a database so you can plan accordingly.
Communication
According to Geodis’ 2017 Supply Chain Worldwide Survey, only six percent of the 623 responders felt that they had full visibility in their supply chains and increasing communication can help that. Tracking a carrier’s communication pattern (timeliness, mode, content, etc.) is an effective way to know if they work well with you and can offer the visibility you require. Carriers who update information like milestones or check calls automatically provide better visibility to your supply chain and can add more value than carriers who must be forced for information.
Number of Shipments
This is a basic, but important metric – how many loads do you ship in a year? In a quarter? Month? Week? It is important to track this data to see your shipping patterns. You need to know how many loads you ship to know how much product to produce at a given time or how much to store. You need to see your peak seasons so you can be prepared with adequate staffing or vendors (like carriers). Once you know how much you ship, you can determine the cost of shipping.
Transportation Costs
Cutting costs is one of the most common and desirable improvements companies make for their supply chains; but, if you are not tracking the costs, you will not know how much you are spending. It is important for you to record rates from each carrier on each lane, year after year. This data combined with outside sources, like Descartes’ Macropoint software or Cass Linehaul Index, can give you an accurate picture of what rates have been and should currently be.
This data is particularly useful in planning and managing your logistics budget throughout the year and forecasting your needs for next year.
Trailer Utilization Rate
Another cost saving measure is to track how much you are spending on partially full trailers. If you are sending a less than truckload (LTL) shipment in a full 53 ft dry van, you could be wasting thousands of dollars per month. Often, companies will only send a few pallets on an entire 53 ft dry van and end up paying for the entire trailer. You can cut costs by either shipping your LTL freight consolidated or by batching up loads and fully utilizing a trailer when you can.
By keeping track of how much of a trailer you normally use, you can work to tailor your supply chain to get the most impact for your money. Work with your customers to send shipments when you can use an entire trailer of product instead of piecemeal and you can save yourself and your customer thousands each month.
Average Dwell Time
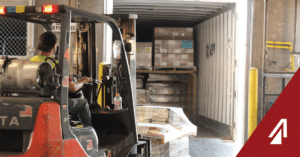
This metric is an internal look at your operation that can also help save money. Dwell time is the time a driver sits in the dock waiting to be loaded or unloaded with freight. If you have less dwell time at your facility, it can save you hundreds if not thousands of dollars in accessorial charges. Holding drivers can accrue large detention fees and can endanger your shipment arriving on time to your customer. You need to monitor when your drivers arrive in relation to their scheduled appointment and monitor the time it takes for your drivers to be loaded. This information could reveal potential internal improvement opportunities such as increasing dock staffing or improving their level of training. Anything you can do to make the load move more smoothly will make you a more desirable company to work for and help save you money.
Out-of-Network Shipments
These shipments are important to track because they are outliers. Out-of-network shipments are loads originating from sub-optimal points or from non-normal routes. These could be alternate pickup or delivery locations or new cities entirely and are by nature infrequent. (If they were frequent, they would be within your network.) Often, because of the change to the normal process, these loads can cost more to the overall transportation budget. So, you need these loads as a metric to identify why costs are going up. If your cost is higher because you added several non-typical loads, you would be able to ignore them as a part of your budget. You would not necessarily build those costs into your next cycle, unless you were adding them to your network.
If your company is looking for continual improvement in your supply chain, you should start by collecting hard data. Once you have a baseline for where you are, you can create goals and systems for where you want to be. These ten metrics are universal basic indicators that you can use to start modifying and improving your supply chain today.


